Debugging InDesign Server
These are some tips that have helped us debug issues with InDesign files failing to process with InDesign Server (IDS).
Use the -LogToApplicationEventLog switch
When starting up InDesign Server from the command line or from the MMC snap-in you can tell it to log events to the Windows Application Event log using the -LogToApplicationEventLog. On a busy production system this perhaps isn't much help but if you're debugging a specific problem on a Dev machine the event log entries can be helpful.
sampleclient.exe
This ships with InDesign Server and for version 18.x of IDS you'll find it in the C:\Program Files\Adobe\Adobe InDesign Server 2023\ directory.
Typically I open two cmd prompts at this directory. In the first I start a new instance of IDS:
1InDesignServer -port <an unused port number>
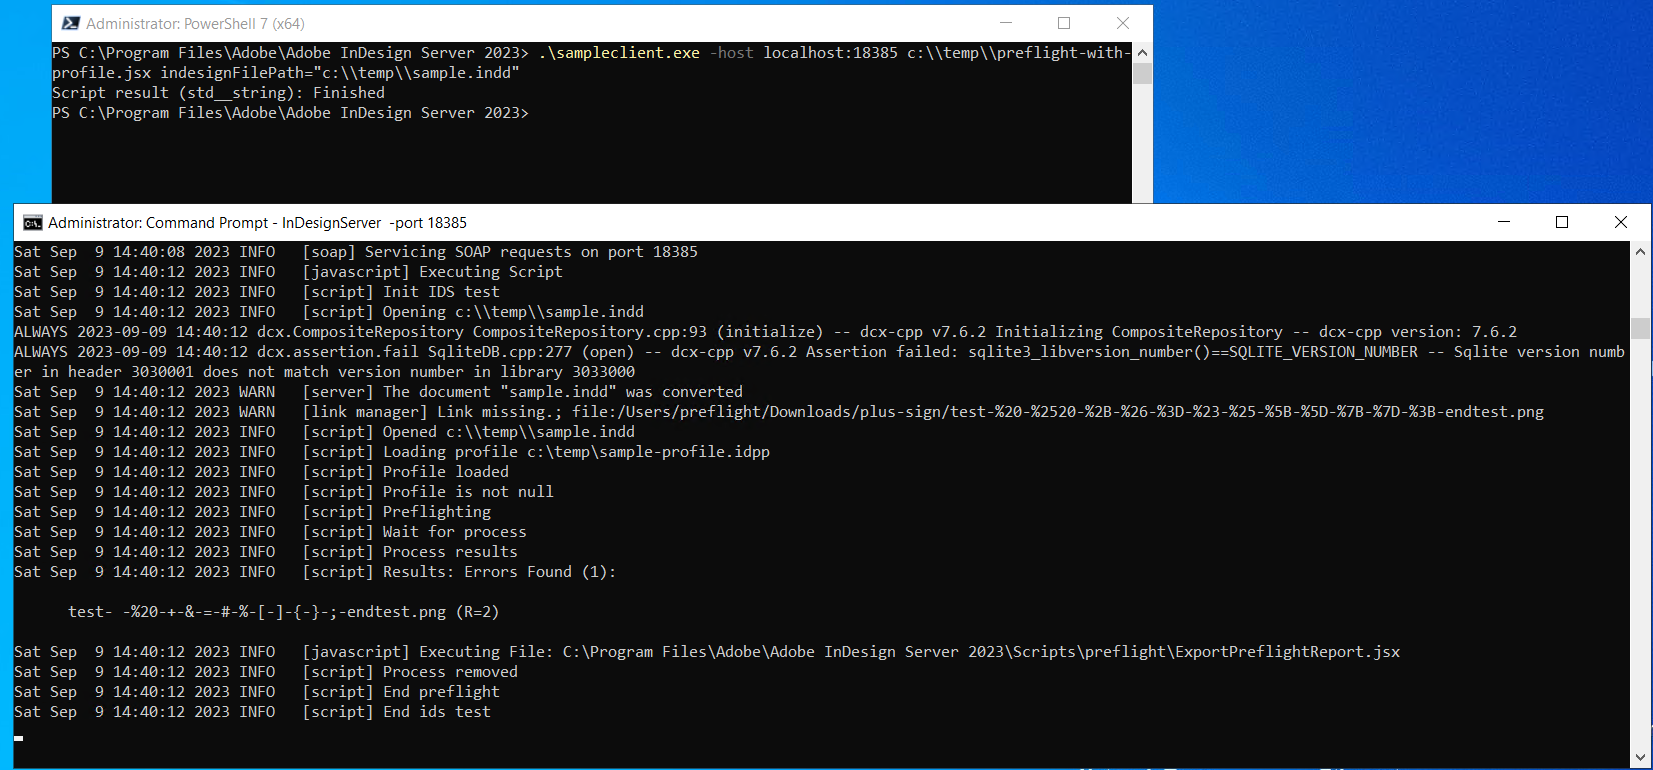
Once it's accepting SOAP requests you can run sampleclient.exe. It takes a host parameter and a file path to the script you'd like to run. And if your script needs parameters values you pass them on the command line too:
1sampleclient -host localhost:18383 <file path>\\<your script>.jsx <param name1>=<param value1> <param name2>=<param value2>
I have a script I use to debug issues with preflight in this repo in Github.
1sampleclient -host localhost:18383 c:\\temp\\preflight-with-profile.jsx indesignFilePath="c:\\temp\\sample.indd"
ExtendScript toolkit and ExtendScript Debugger Extension for VS Code
To be honest I haven't used these tools so much. Partly becuase of InDesign Server licensing, I don't run a version of IDS locally on my Dev machine. From time to time I'll run a Trial or pre-release version in a VM. And partly because the Dev, Stage and Prod VMs where we have IDS running are locked down and installing Dev tools like these will get me into trouble. I find the IDS console output the most useful so stick to sampleclient.exe debugging. It's slow and a bit finicky but it usually gets you some useful information.